
Reshaping Data in Polars: The pivot() Method (Long to Wide)
In data analysis, you’re constantly reshaping data. we used melt() to turn “wide” data into “long” data. Today, we’re doing the opposite. pivot() is the…
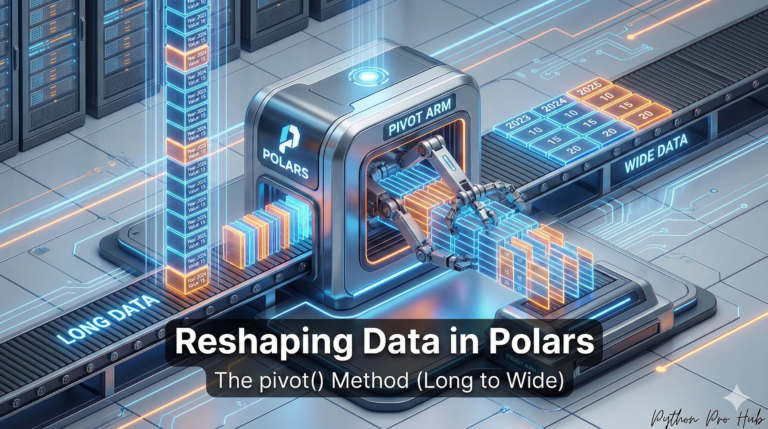
In data analysis, you’re constantly reshaping data. we used melt() to turn “wide” data into “long” data. Today, we’re doing the opposite. pivot() is the…

Let’s say you have a 10GB file with a “Country” column. The string “United States of America” might appear 50 million times, using a massive…

We’ve used the Polars Expression API a lot. But what is an expression? An expression, or pl.Expr, is a recipe for a calculation. It’s not…

So far, we’ve used Polars in “Eager” mode (like Pandas), where df.filter() runs immediately. However, the Polars Lazy API offers a different approach to working…
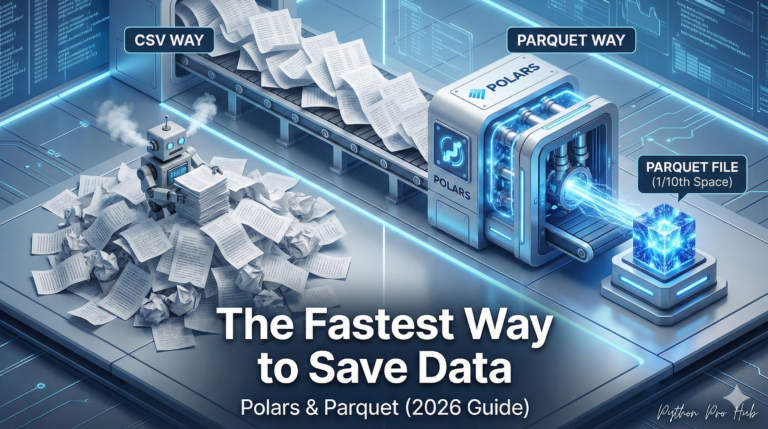
You’ve been taught to use .csv files for everything. This is fine for small files, but for data science in 2026, it’s slow and inefficient….

It’s very common to have a column in your data that contains a JSON string. In Pandas, this is slow and difficult to work with….
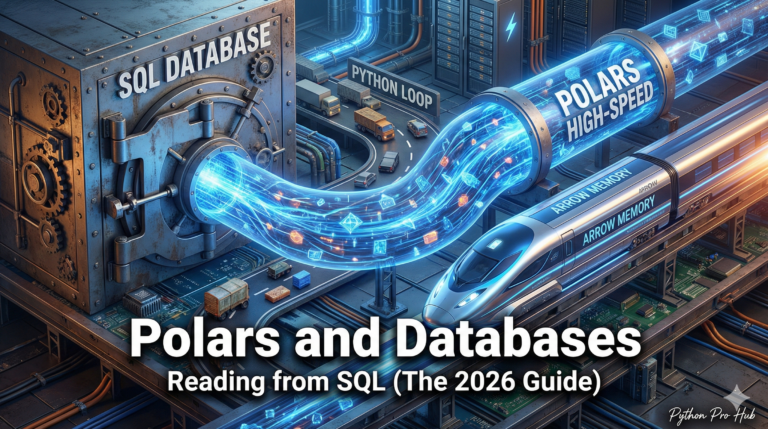
In the real world, data doesn’t just live in CSV files. It lives in SQL databases. If you’re looking for a simple way to use…
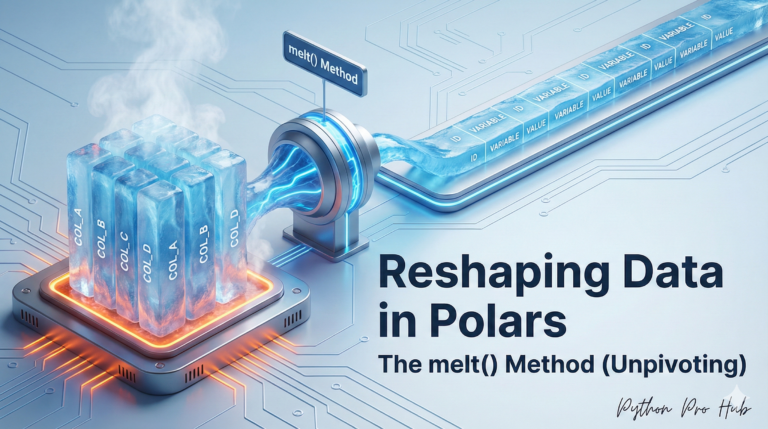
Your data is often in a “wide” format, like a spreadsheet, but analysis tools (like plotting libraries) prefer “long” format. One useful function for this…

One of the most common data tasks is creating a new column based on a condition. In this tutorial, we’ll focus on using Polars when…

Just loading dates isn’t enough. For real analysis, you need to “engineer features” from them, like “What day of the week do most sales happen?”…