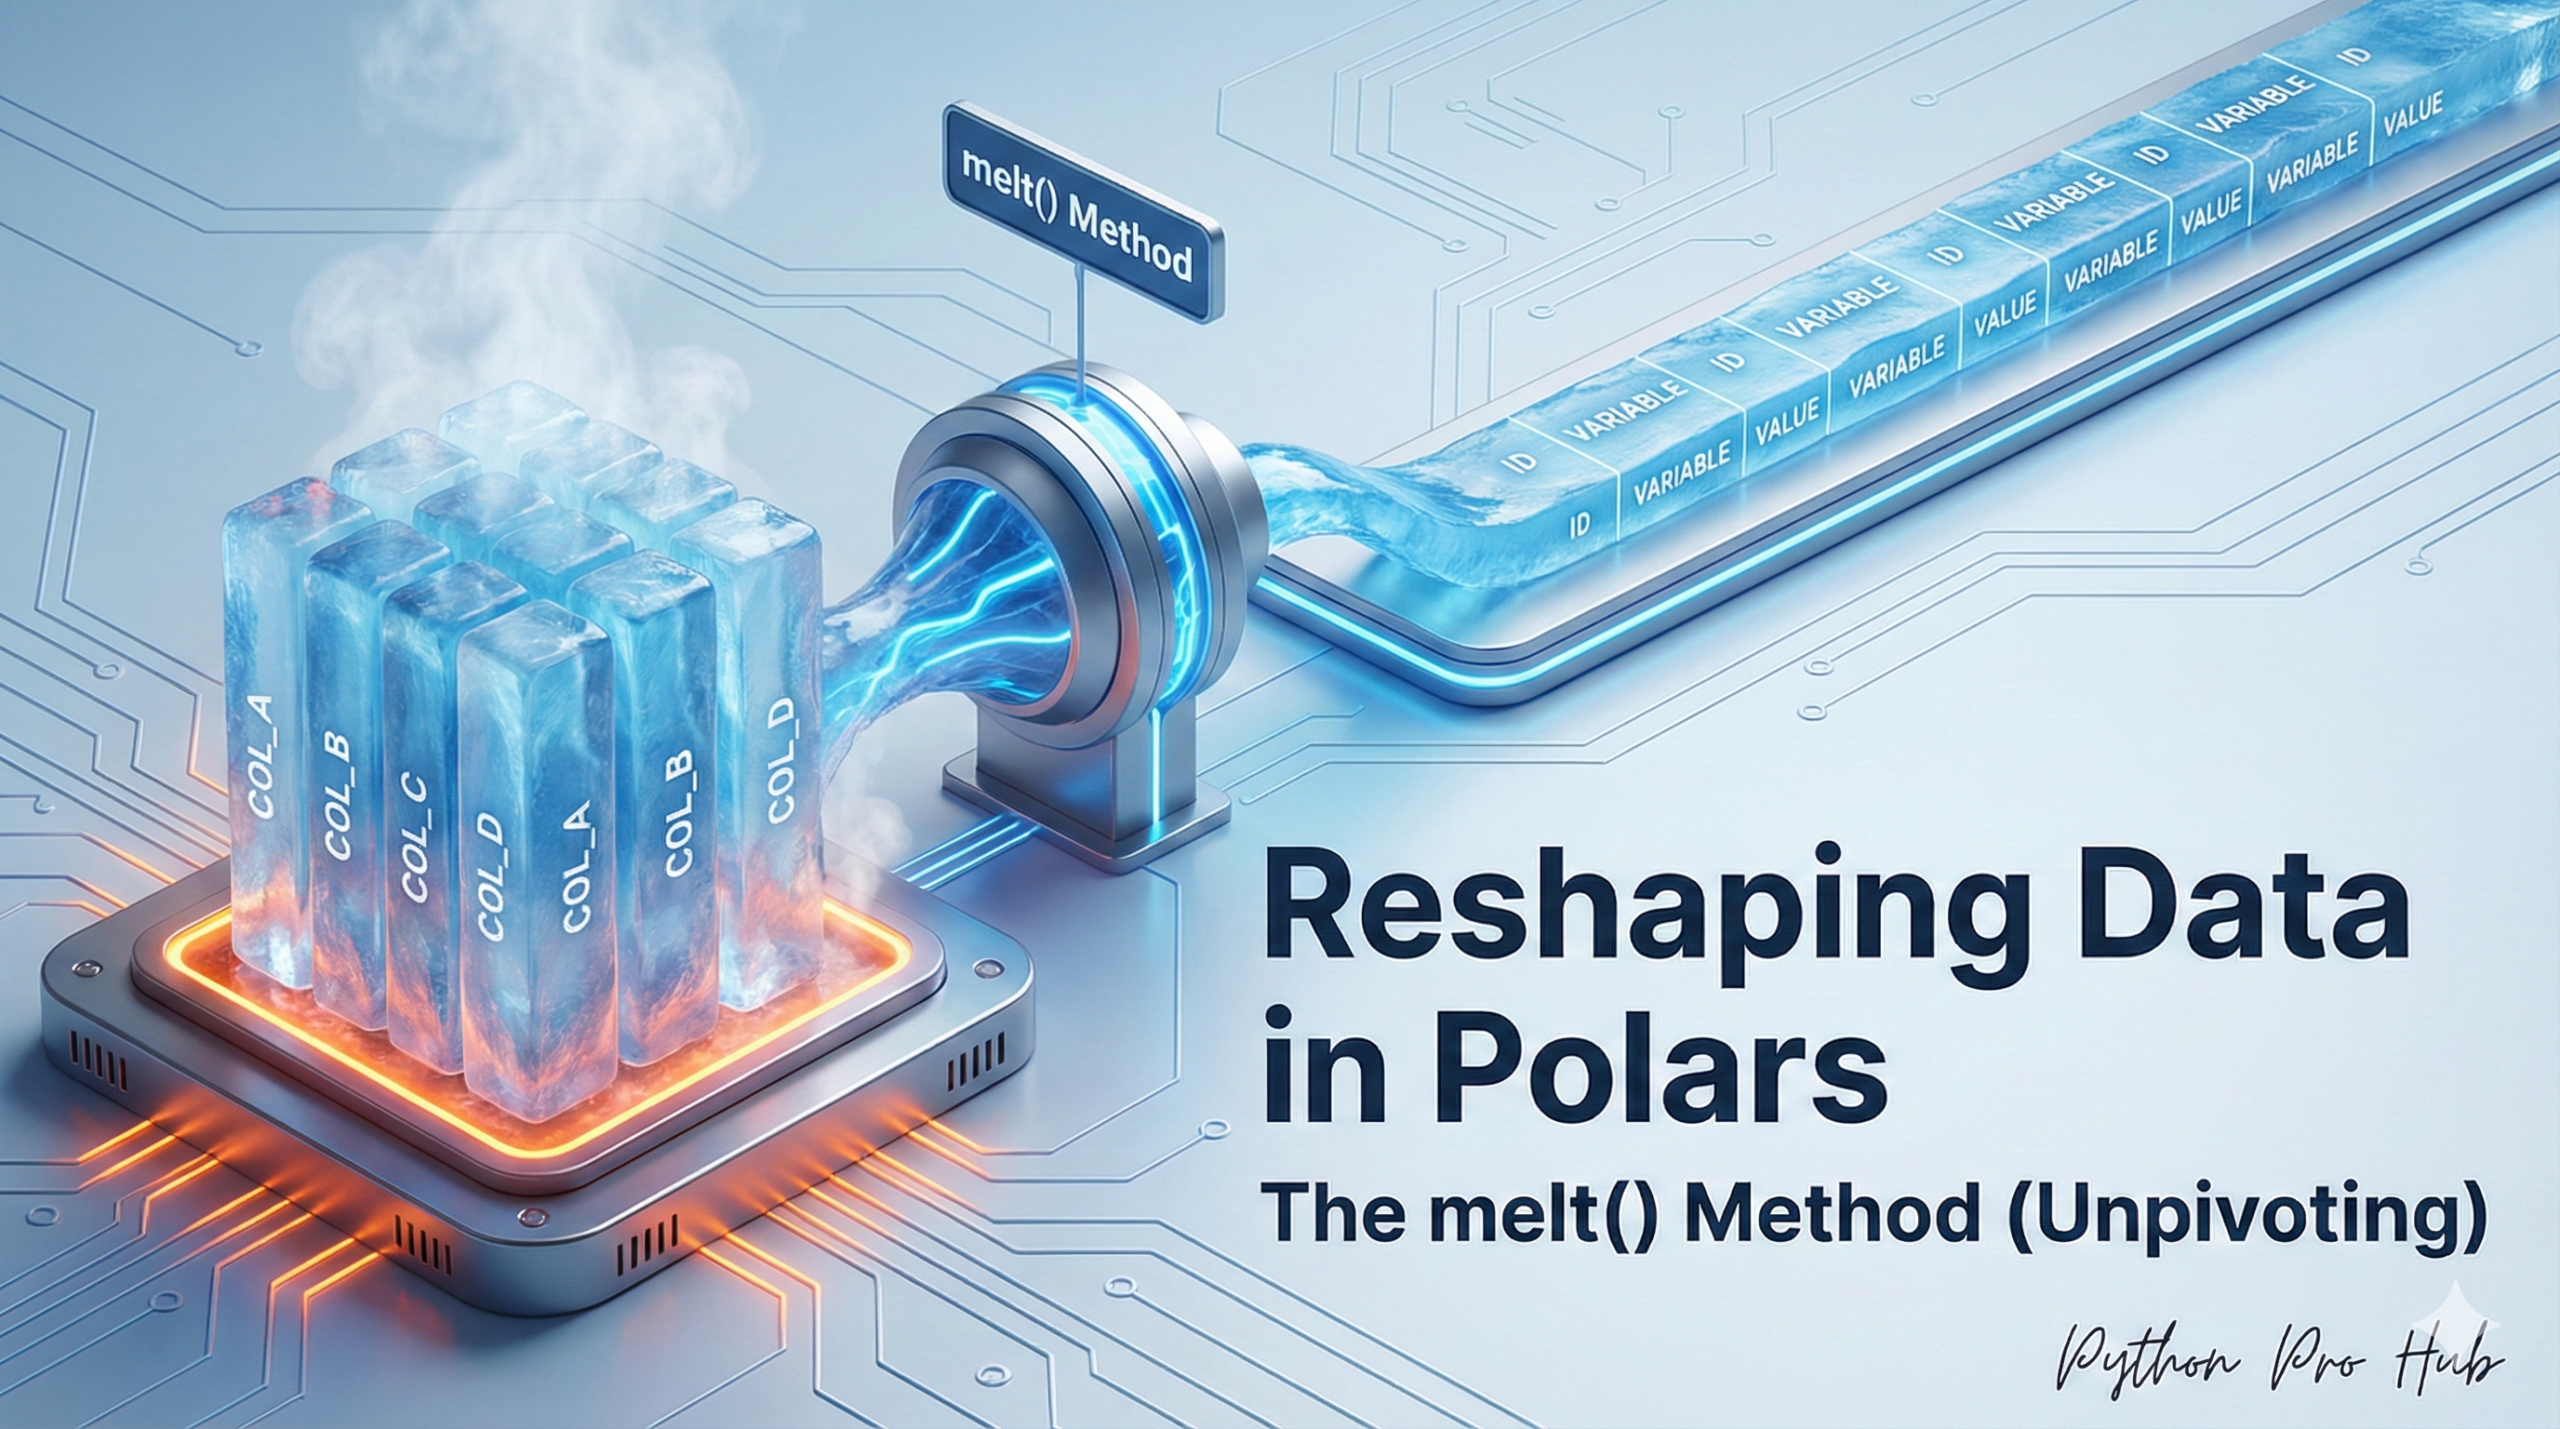
Your data is often in a “wide” format, like a spreadsheet, but analysis tools (like plotting libraries) prefer “long” format. One useful function for this transformation is Polars melt, which helps you reshape data efficiently.
Wide Data (Bad for analysis): | student | exam1 | exam2 | | :— | :— | :— | | Alice | 90 | 85 | | Bob | 80 | 95 |
Long Data (Good for analysis): | student | exam | score | | :— | :— | :— | | Alice | exam1 | 90 | | Alice | exam2 | 85 | | Bob | exam1 | 80 | | Bob | exam2 | 95 |
The Polars function to do this transformation is melt().
The Code
import polars as pl
df_wide = pl.DataFrame({
    "student": ["Alice", "Bob"],
    "exam1": [90, 80],
    "exam2": [85, 95]
})

# 1. 'id_vars' are the columns to KEEP (don't unpivot)
# 2. 'value_vars' are the columns to MELT DOWN
df_long = df_wide.melt(
    id_vars="student",
    value_vars=["exam1", "exam2"],
    variable_name="exam",  # Name for the new "key" column
    value_name="score"     # Name for the new "value" column
)
print(df_long)
Output:
shape: (4, 3)
┌─────────┬───────┬───────┐
│ student ┆ exam  ┆ score │
│ ---     ┆ ---   ┆ ---   │
│ str     ┆ str   ┆ i64   │
╞═════════╪═══════╪═══════╡
│ Alice   ┆ exam1 ┆ 90    │
│ Bob     ┆ exam1 ┆ 80    │
│ Alice   ┆ exam2 ┆ 85    │
│ Bob     ┆ exam2 ┆ 95    │
└─────────┴───────┴───────┘
This “tidy data” format is essential for plotting with libraries like Seaborn and is a fundamental skill in data cleaning.