
Polars Feature Engineering: Lags, Diffs, and Percent Changes
If you are training a Machine Learning model to predict stock prices or sales, you can’t just feed it “Today’s Price.” You need to feed…
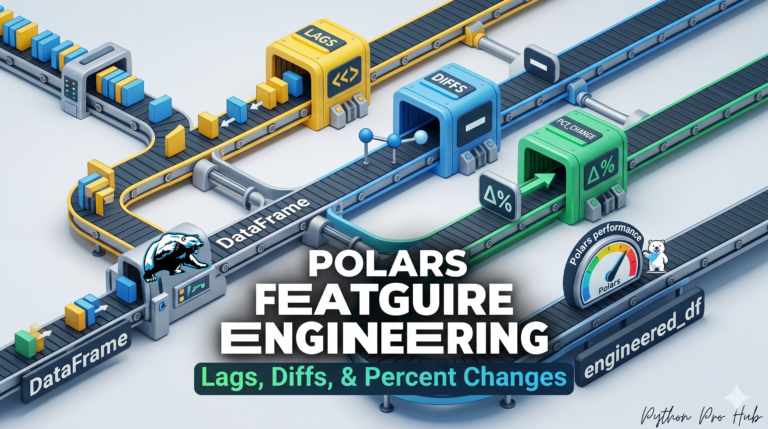
If you are training a Machine Learning model to predict stock prices or sales, you can’t just feed it “Today’s Price.” You need to feed…
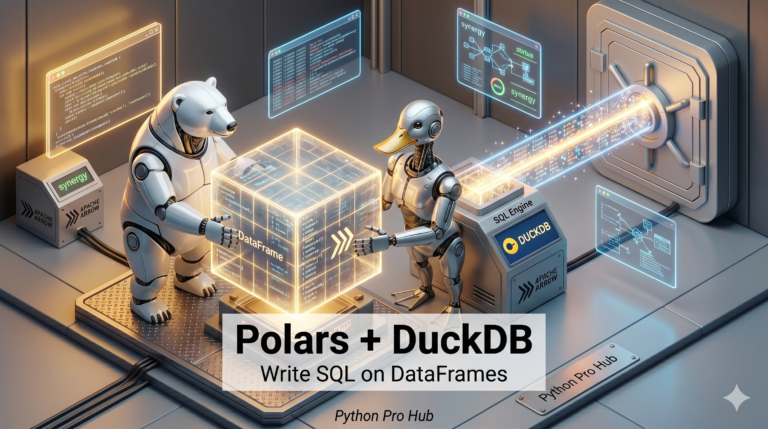
You love Polars for its speed, but sometimes you just miss writing SQL. Maybe a colleague gave you a complex query and you don’t want…
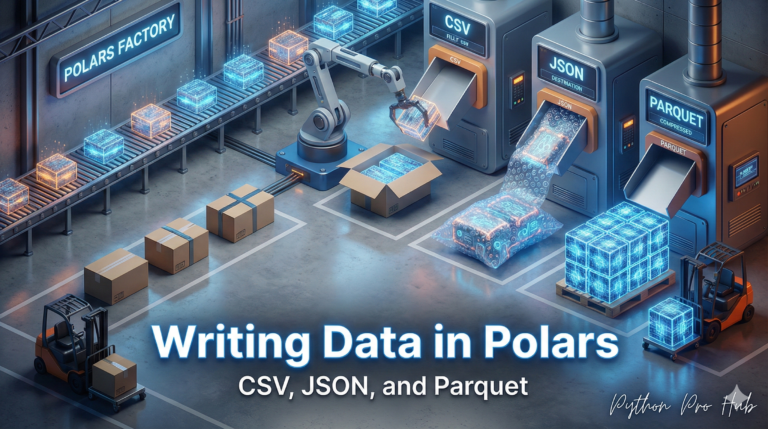
You’ve read, cleaned, and analyzed your data in Polars. Now you need to save your results. If you’ve ever wondered how Polars write data when…
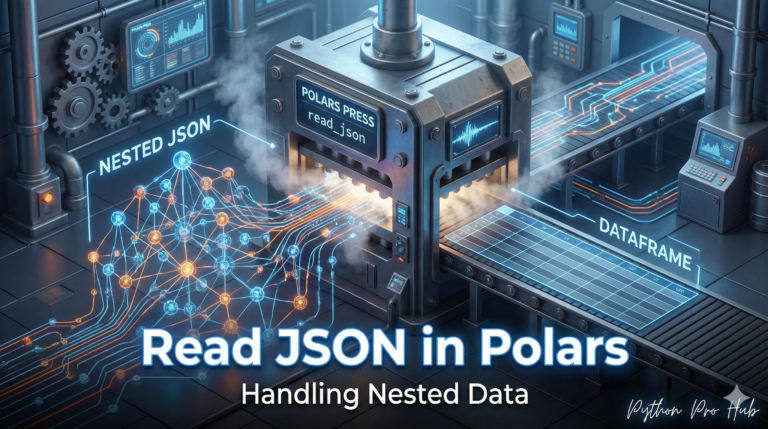
You’ve learned to read CSVs, Parquet, and Excel. But many APIs and modern databases (like MongoDB) output JSON files. In this tutorial, you’ll learn how…
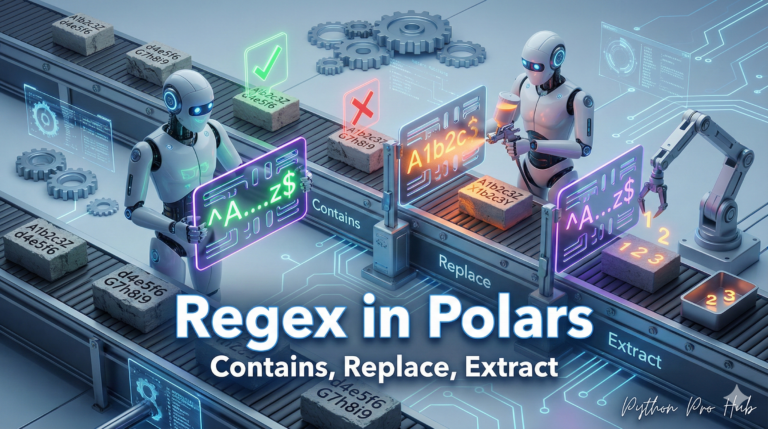
In our Polars string guide, we covered basic text cleaning. When your data demands pattern-level precision, Polars regex delivers — it builds Regular Expression (Regex)…

We know that .map_elements() is slow because it runs row-by-row. We know that .group_by().agg() is super fast, but it’s limited to simple functions (like sum,…
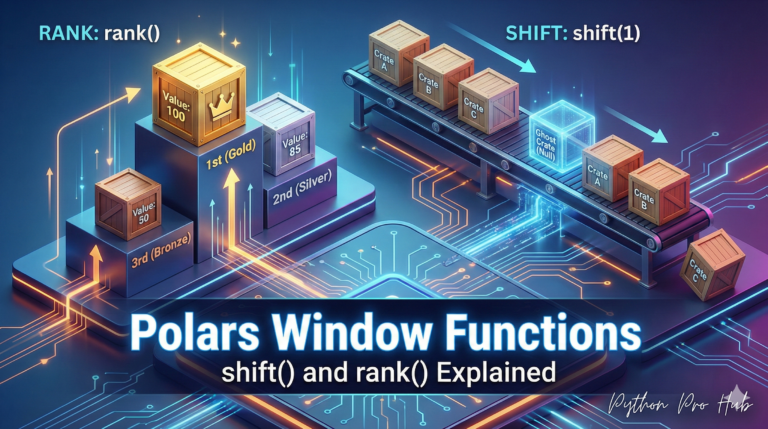
Today we’re covering two powerful Polars Expressions: shift and rank. These are essential for financial analysis, ranking, and finding trends. In this article you’ll learn…

You’ve learned all the individual Polars methods. Now, let’s put them together in one “A-to-Z” project to clean a messy dataset and look at effective…

Matplotlib and Seaborn create static, non-interactive images. In 2026, data exploration is interactive. hvplot is a library that provides a .hvplot() method for Pandas and…
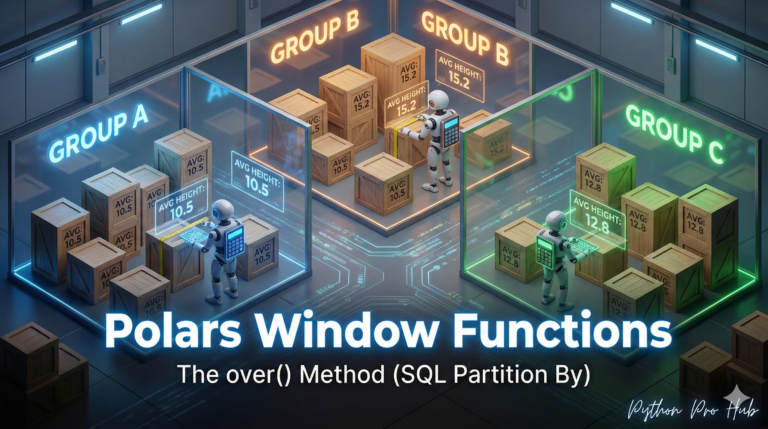
We’ve used groupby().agg(), which collapses your data (e.g., 100 rows become 3 rows). In contrast, Polars window functions allow you to compute calculations across groups…