If you are training a Machine Learning model to predict stock prices or sales, you can’t just feed it “Today’s Price.” You need to feed it Features.
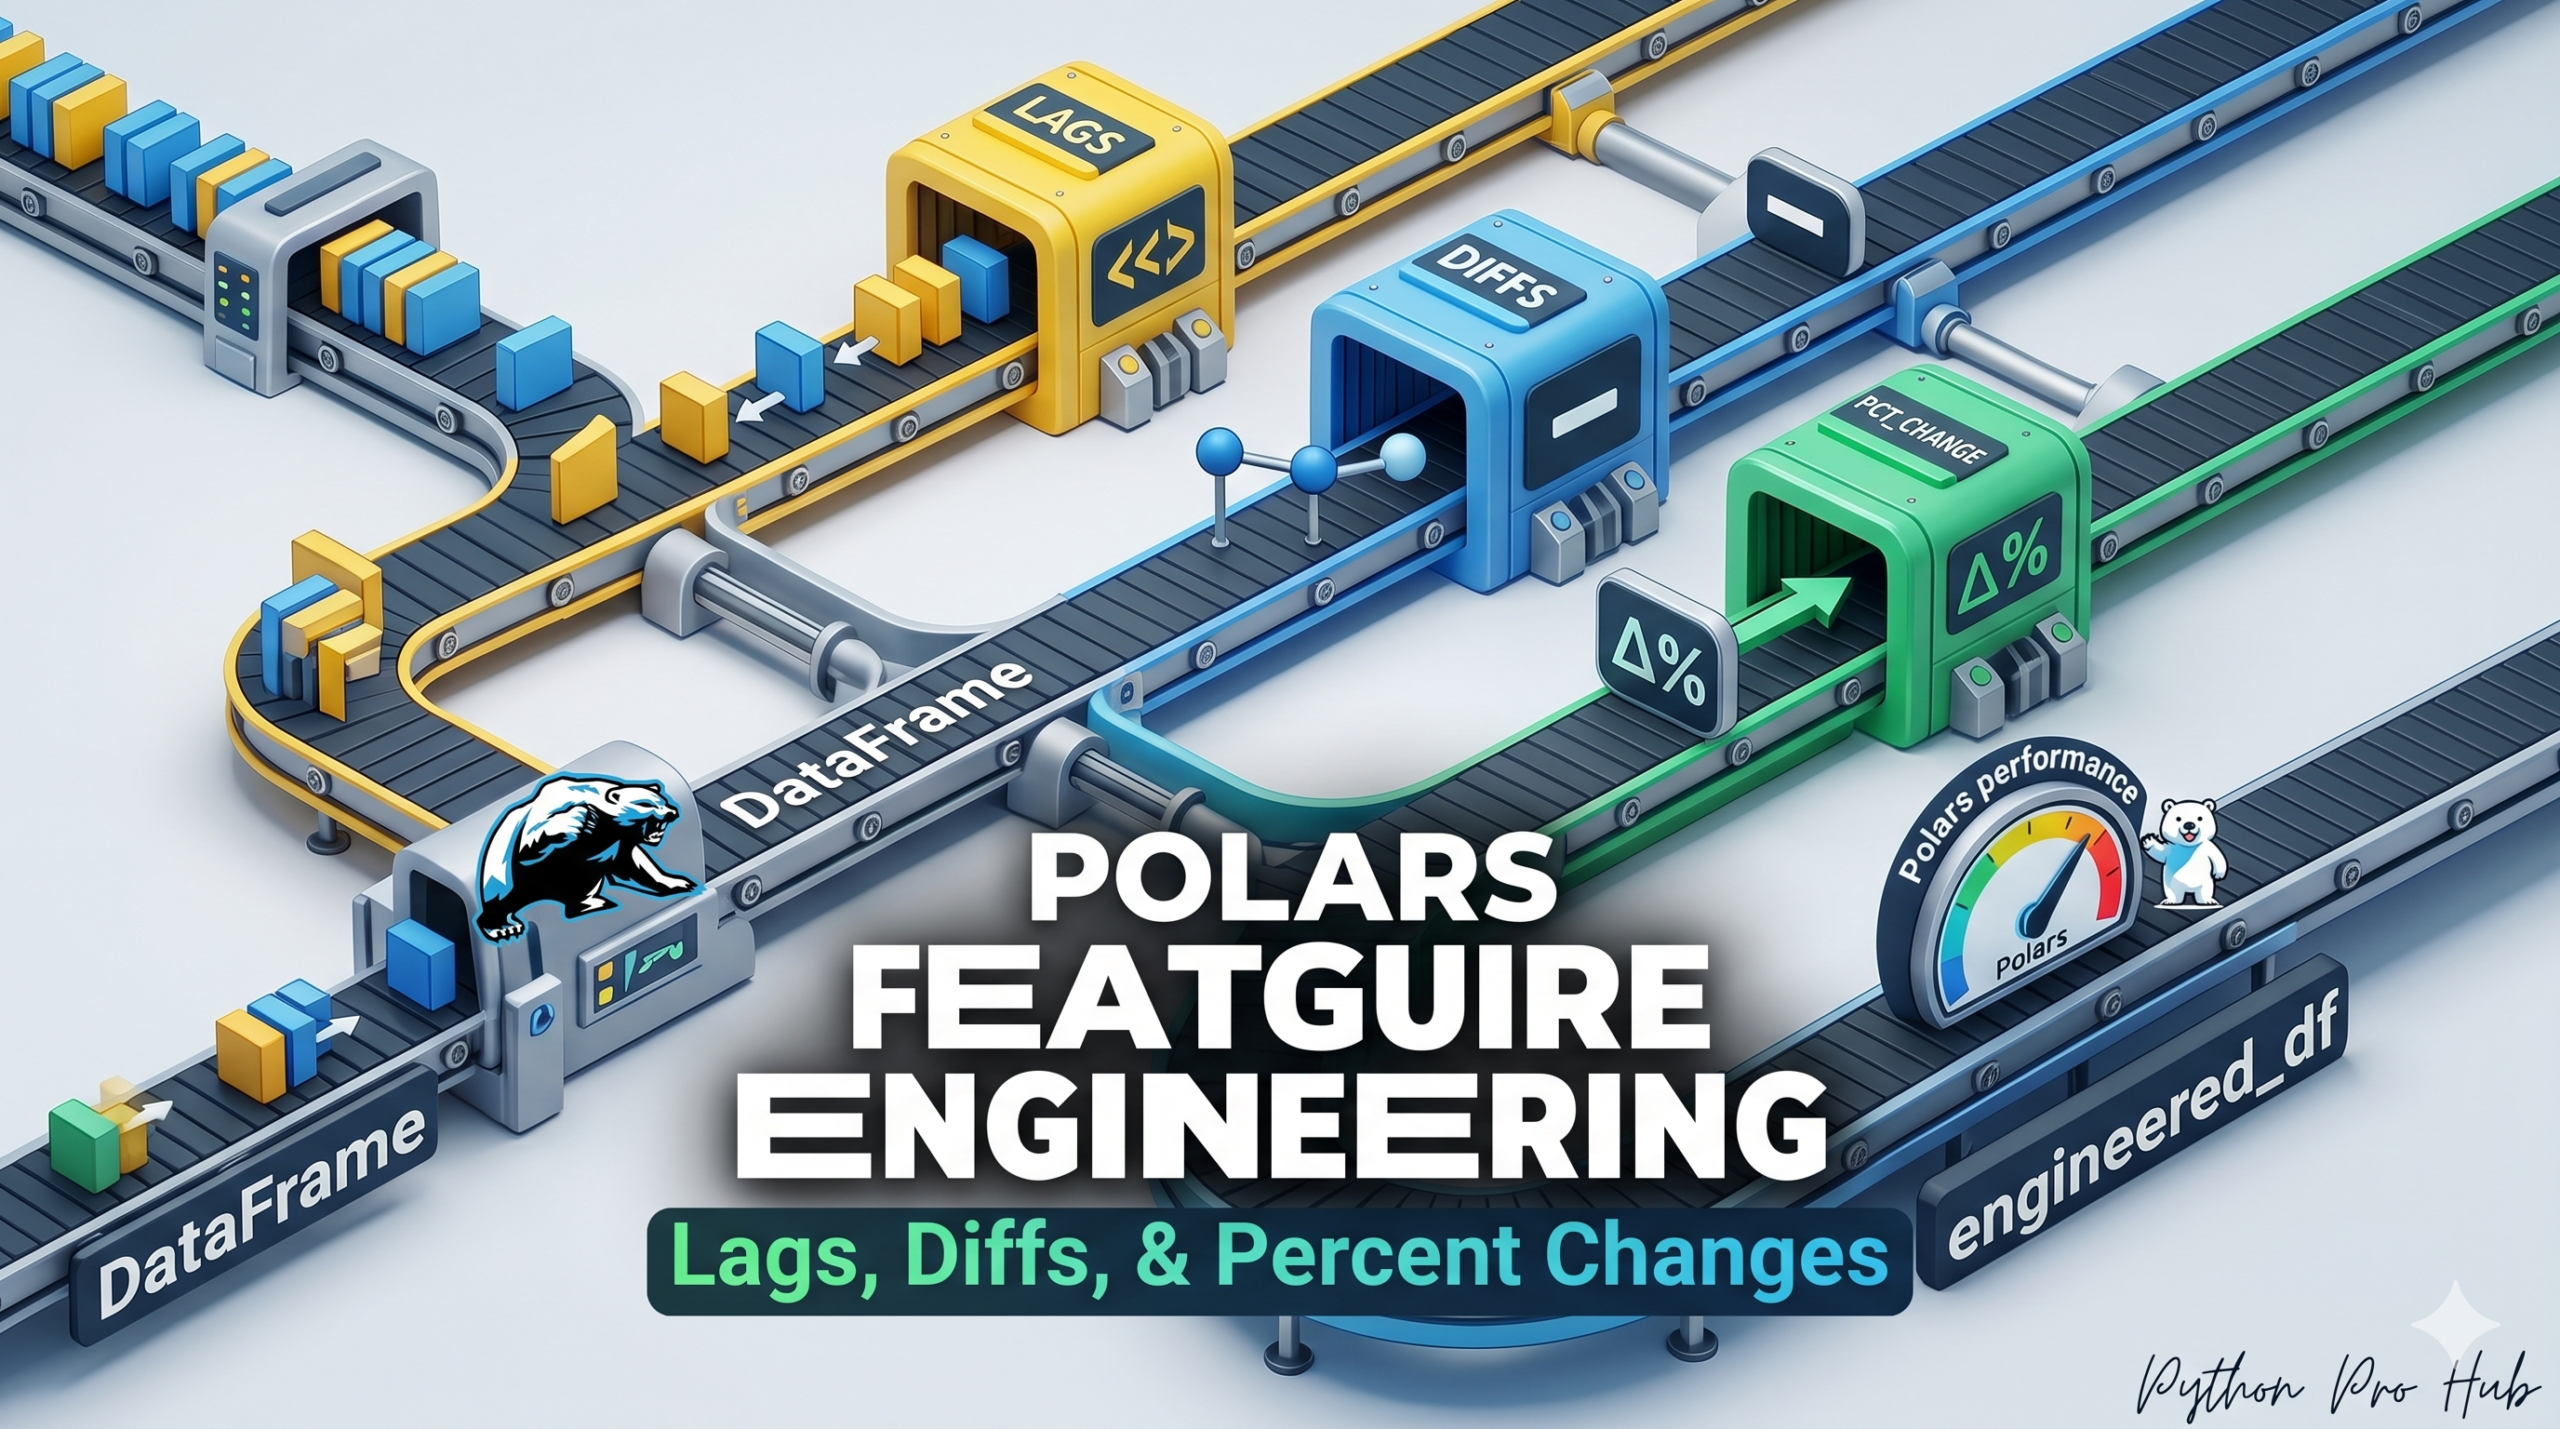
- “What was the price yesterday?” (Lag)
- “How much did it go up since yesterday?” (Diff)
- “What percentage did it drop?” (Percent Change)
Polars makes creating these features incredibly fast.
The Setup
import polars as pl

df = pl.DataFrame({
    "day": [1, 2, 3, 4, 5],
    "price": [100, 102, 101, 110, 120]
})
1. The Lag (shift)
This moves data down by n rows. Useful for “yesterday’s value.”
df.with_columns(
    pl.col("price").shift(1).alias("price_yesterday")
)
2. The Diff (diff)
This calculates Today - Yesterday.
df.with_columns(
    # How much did the price change?
    pl.col("price").diff(n=1).alias("price_change_usd")
)
3. The Percent Change (pct_change)
This calculates (Today - Yesterday) / Yesterday. This is crucial for normalizing data.
df.with_columns(
    # Did it go up 1% or 10%?
    pl.col("price").pct_change(n=1).alias("growth_rate")
)
Putting it Together
You typically create all of these at once for your ML model.
df_ml_ready = df.with_columns([
    pl.col("price").shift(1).alias("lag_1"),
    pl.col("price").diff(1).alias("diff_1"),
    pl.col("price").pct_change(1).alias("pct_change_1")
])
print(df_ml_ready)
Output:
shape: (5, 5)
┌─────┬───────┬───────┬────────┬──────────────┐
│ day ┆ price ┆ lag_1 ┆ diff_1 ┆ pct_change_1 │
│ --- ┆ ---   ┆ ---   ┆ ---    ┆ ---          │
│ i64 ┆ i64   ┆ i64   ┆ i64    ┆ f64          │
╞═════╪═══════╪═══════╪════════╪══════════════╡
│ 1   ┆ 100   ┆ null  ┆ null   ┆ null         │
│ 2   ┆ 102   ┆ 100   ┆ 2      ┆ 0.02         │
│ 3   ┆ 101   ┆ 102   ┆ -1     ┆ -0.009804    │
│ 4   ┆ 110   ┆ 101   ┆ 9      ┆ 0.089109     │
│ 5   ┆ 120   ┆ 110   ┆ 10     ┆ 0.090909     │
└─────┴───────┴───────┴────────┴──────────────┘
Handling the Missing Data You will notice that the first row contains null values. This happens because there is no “yesterday” for Day 1. Most Machine Learning models (like XGBoost or Scikit-Learn) will throw an error if you feed them nulls.
Before using this data, you should remove that first row:
# Remove rows with missing values to prevent ML errors
df_clean = df_ml_ready.drop_nulls()
print(df_clean)
Conclusion Polars makes feature engineering incredibly efficient. By using shift, diff, and pct_change, you can transform raw time-series data into meaningful patterns that help your model learn trends rather than just isolated numbers.
Key Takeaways
- To predict stock prices or sales, you must feed your model relevant Features instead of just ‘Today’s Price’.
- Key features include Lag (yesterday’s value), Diff (difference between today and yesterday), and Percent Change (normalised change).
- Polars simplifies feature engineering, making it quick to create these necessary features for Machine Learning models.
- Make sure to handle missing data; remove the first row with null values before using the data in your model.
- Utilising Polars for feature engineering allows your model to learn trends rather than isolated numbers.