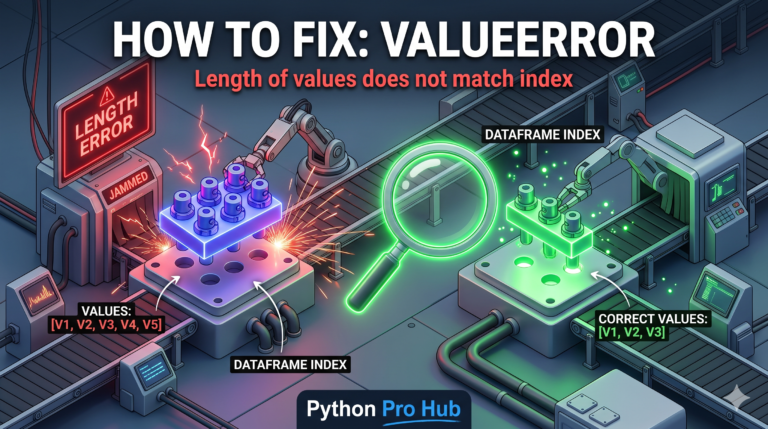
How to Fix: ValueError: Length of values does not match length of index
This ValueError length of values is the #1 error beginners face when manipulating Pandas DataFrames. It means: “You have a DataFrame with 10 rows, but…
This ValueError length of values is the #1 error beginners face when manipulating Pandas DataFrames. It means: “You have a DataFrame with 10 rows, but…

We’ve used .join() to combine data based on a key (like a SQL JOIN). But what if you just want to stack two DataFrames on…

We’ve covered two types of window functions in Polars. Now, we’ll look at how to use Polars group_by_rolling functionality. group_by_rolling() is the third type. It’s…

We’ve learned how to group time by month (using group_by_dynamic), but what about calculating a “7-day moving average”? This is where Polars rolling functions can…
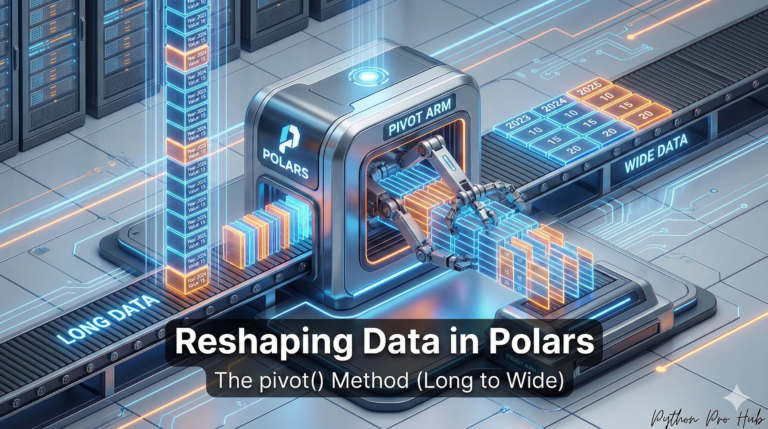
In data analysis, you’re constantly reshaping data. we used melt() to turn “wide” data into “long” data. Today, we’re doing the opposite. pivot() is the…

We’ve used the Polars Expression API a lot. But what is an expression? An expression, or pl.Expr, is a recipe for a calculation. It’s not…

Your data is often in a “wide” format, like a spreadsheet, but analysis tools (like plotting libraries) prefer “long” format. One useful function for this…

One of the most common data tasks is creating a new column based on a condition. In this tutorial, we’ll focus on using Polars when…

One of the most common tasks in data analysis is “resampling” time data. For example, turning a list of daily sales into “Total Monthly Sales.”…
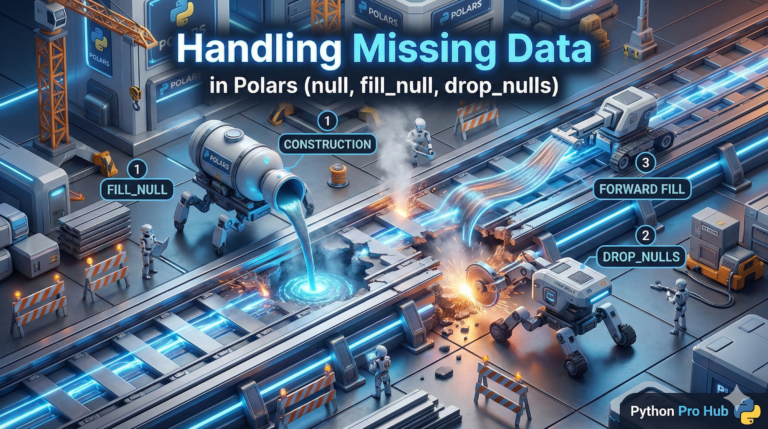
Just like Pandas has NaN, Polars has null to represent missing or empty data. Before you can analyze a dataset, you must have a strategy…