Data Visualization in Python: Seaborn for Beautiful Charts
While Matplotlib is powerful, its default charts can look a bit… basic. For those new to data visualization, a Seaborn Beginner Guide can be very…
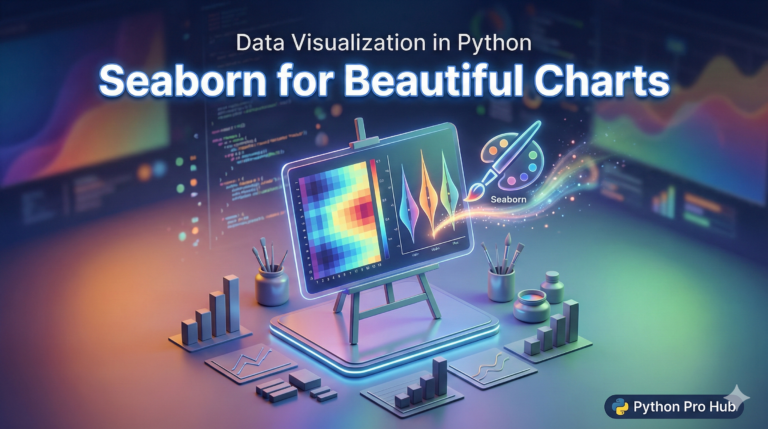
While Matplotlib is powerful, its default charts can look a bit… basic. For those new to data visualization, a Seaborn Beginner Guide can be very…
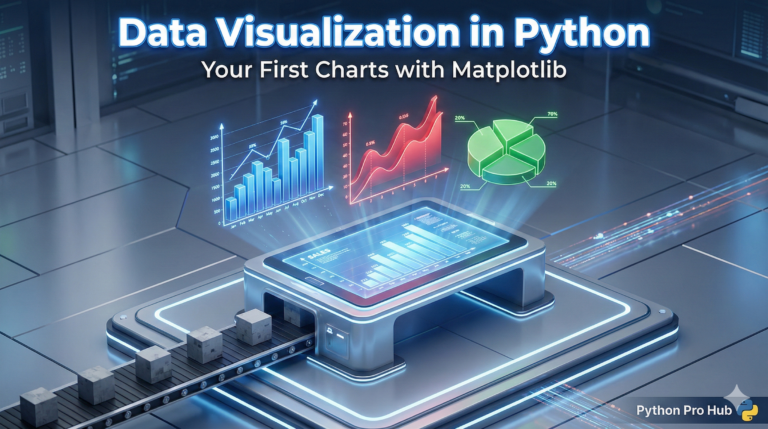
Numbers in a table can only tell you so much. To see trends, patterns, and outliers, you need to visualize your data. This Matplotlib Beginner…
We use cookies to improve your experience on our site. By using our site, you consent to cookies.
Manage your cookie preferences below:
Essential cookies enable basic functions and are necessary for the proper function of the website.
You can find more information about our Cookie Policy and Privacy Policy.